


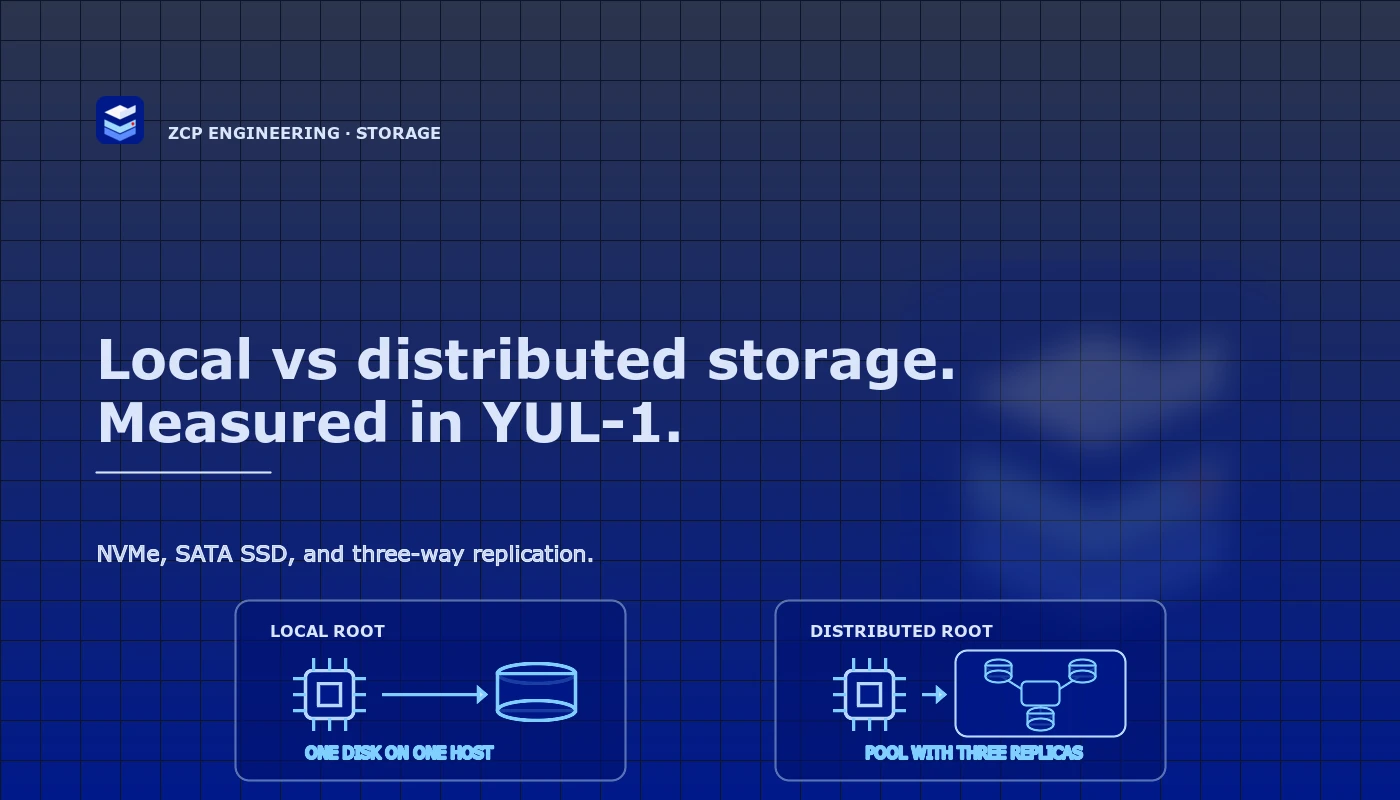
What is root storage?
Root storage is your VM’s main disk. It holds the operating system and the files needed to start the server.
ZCP offers two root-storage options:
- Local root storage: Faster and lower cost, with the disk kept on the same physical host as the VM.
- Shared replicated root storage: Stores three copies on separate storage hosts, providing stronger protection if a host fails.
Local storage favors performance and lower cost. Shared replicated storage favors resilience and host recovery, with added network and replication overhead.
Executive decision
The right storage tier depends on the workload’s recovery design. Local storage costs less and delivered lower latency in this test. Shared replicated storage carries a higher price because it keeps data outside one compute host and supports a different recovery model.
| Workload | Recommended tier | Reason |
|---|---|---|
| Database replica, cache, build runner, scratch data, or rebuildable index | Host-local NVMe or SATA SSD | Prioritize direct disk performance when the application already manages recovery |
| Production data that needs shared storage and host-level recovery | Shared replicated storage | Pay for distributed placement and a stronger platform recovery boundary |
| Backup, archive, or data with a longer recovery window | Compare object or backup storage first | Avoid paying block-storage rates for data that does not need block semantics |
The current pricing page shows the published storage rates and local-tier status. The storage reference covers selection, sizing, region guidance, and recovery precautions. If you need help mapping a workload to a recovery objective, contact ZSoftly with the data size, I/O pattern, and recovery target.
We deployed eight new Ubuntu VMs to measure the difference. Every VM had one vCPU, 1 GB of memory, one 40 GB root volume, and no data volume.
The test used two matched comparisons:
- Intel hosts with replicated distributed roots versus local SATA SSD roots.
- AMD hosts with replicated distributed roots versus local NVMe roots.
Each local VM shared its CPU family, compute host, guest size, and operating system image with a distributed-storage control. This pairing keeps the result focused on the root-storage path.
Results at a glance
Each value averages the two host medians in its tier. Every host completed three timed runs per profile. Read and write values appear in that order.
| Measurement | Distributed, Intel | Local SATA SSD, Intel | Distributed, AMD | Local NVMe, AMD |
|---|---|---|---|---|
| 4 KiB QD1 read/write IOPS | 611 / 95 | 2,376 / 4,122 | 654 / 59 | 3,207 / 3,519 |
| 4 KiB QD1 mean read/write latency | 1.64 / 12.06 ms | 0.40 / 0.25 ms | 1.65 / 19.64 ms | 0.29 / 0.26 ms |
| 4 KiB QD64 read/write IOPS | 39,487 / 1,993 | 81,747 / 64,540 | 31,286 / 1,540 | 106,955 / 105,518 |
| 4 KiB QD64 mean read/write latency | 1.72 / 35.37 ms | 0.78 / 0.98 ms | 3.58 / 42.30 ms | 0.59 / 0.60 ms |
| 4 KiB QD128 read/write IOPS | 48,202 / 5,059 | 80,480 / 63,227 | 32,102 / 3,356 | 113,573 / 110,525 |
| 1 MiB QD32 read/write throughput | 1,863 / 94 MiB/s | 419 / 503 MiB/s | 2,496 / 63 MiB/s | 2,016 / 6,089 MiB/s |
Intel local SATA SSD versus Intel distributed storage
At QD1, local SATA SSD delivered 3.9 times the read IOPS and 43.4 times the write IOPS of its distributed controls. Mean read latency was 75.7% lower. Mean write latency was 97.9% lower.
At QD64, local SATA SSD delivered 2.1 times the read IOPS and 32.4 times the write IOPS. Raising the queue to 128 produced no useful local throughput gain and increased latency.
The distributed tier led 1 MiB sequential reads by 4.4 times. Local SATA SSD led sequential writes by 5.3 times.
AMD local NVMe versus AMD distributed storage
At QD1, local NVMe delivered 4.9 times the read IOPS and 59.5 times the write IOPS of its distributed controls. Mean read latency was 82.4% lower. Mean write latency was 98.7% lower.
At QD64, local NVMe delivered 3.4 times the read IOPS and 68.5 times the write IOPS. QD128 added 6.2% read IOPS and 4.7% write IOPS while almost doubling mean latency.
The distributed tier led 1 MiB sequential reads by 1.2 times. Local NVMe led sequential writes by 97.4 times.
The exact test runs
Run A and Run B represent separate compute hosts within each matched host pair. Infrastructure identifiers are excluded from this report. Each cell contains the median from three runs. Read and write values appear in that order.
| Root storage | CPU | Run | QD1 IOPS R/W | QD1 mean latency R/W | QD64 IOPS R/W | 1 MiB throughput R/W |
|---|---|---|---|---|---|---|
| Distributed | Intel | A | 715 / 60 | 1.37 / 16.48 ms | 29,739 / 1,383 | 2,162 / 75 MiB/s |
| Distributed | Intel | B | 507 / 130 | 1.91 / 7.64 ms | 49,234 / 2,603 | 1,564 / 113 MiB/s |
| Local SATA SSD | Intel | A | 2,680 / 5,535 | 0.34 / 0.17 ms | 84,216 / 66,851 | 411 / 500 MiB/s |
| Local SATA SSD | Intel | B | 2,072 / 2,710 | 0.45 / 0.33 ms | 79,279 / 62,229 | 427 / 506 MiB/s |
| Distributed | AMD | A | 847 / 81 | 1.15 / 12.24 ms | 51,658 / 1,384 | 2,083 / 66 MiB/s |
| Distributed | AMD | B | 461 / 37 | 2.14 / 27.04 ms | 10,913 / 1,695 | 2,909 / 59 MiB/s |
| Local NVMe | AMD | A | 3,276 / 3,552 | 0.28 / 0.25 ms | 105,621 / 101,399 | 2,040 / 6,062 MiB/s |
| Local NVMe | AMD | B | 3,138 / 3,485 | 0.30 / 0.26 ms | 108,289 / 109,637 | 1,991 / 6,115 MiB/s |
The distributed QD64 read results varied across hosts. The AMD pair ranged from 10,913 to 51,658 IOPS. The Intel pair ranged from 29,739 to 49,234 IOPS. These results describe the measured sample, not a fixed service rate.
Comparison with published network-volume limits
DigitalOcean publishes limits of 7,500 IOPS and 300 MB/s for shared volumes. Its listed burst limits reach 15,000 IOPS and 525 MB/s.
The local tiers crossed those published IOPS limits in this test. Local SATA SSD averaged 81,747 QD64 read IOPS and 64,540 write IOPS. Local NVMe averaged 106,955 read IOPS and 105,518 write IOPS.
Throughput tells a different story. Local SATA SSD averaged 419 MiB/s for sequential reads and 503 MiB/s for sequential writes. Local NVMe averaged 2,016 MiB/s for sequential reads and 6,089 MiB/s for sequential writes.
This is not an equivalent service comparison. DigitalOcean Volumes are network-attached block storage. ZCP local volumes are tied to one compute host and do not include storage-level replication, cross-host migration, or storage-backed high availability. The distributed ZCP tier exceeded 15,000 QD64 read IOPS in this sample, but its write IOPS and write latency trailed the published DigitalOcean limits.
How we tested
The comparison used eight disposable Ubuntu VMs:
- Four replicated distributed root volumes, with two on Intel hosts and two on AMD hosts.
- Two local SATA SSD root volumes on the same Intel host pair as their distributed controls.
- Two local NVMe root volumes on the same AMD host pair as their distributed controls.
- One vCPU, 1 GB of memory, and one 40 GB root volume per VM.
- The same operating system image and software configuration.
- No data volumes.
Platform placement records confirmed every distributed root on the shared storage pool. They also confirmed every local root on its intended host-local pool.
The test used fio 3.36 with a 20 GiB file inside each root filesystem. Every file received a complete direct-I/O preconditioning write before measurement. The hypervisor disk configuration used cache='none' for both local and distributed roots.
We ran 192 timed samples serially. Each sample used a five-second ramp followed by a 30-second measurement window. Each VM completed three repetitions of these profiles:
- 4 KiB random read and random write at queue depths 1, 64, and 128.
- 1 MiB sequential read and sequential write at queue depth 32.
- Linux native asynchronous I/O with direct I/O enabled.
We calculated the median of the three runs on each host. The summary table averages the two host medians in each tier. This prevents one burst result from defining the tier.
We removed every 20 GiB benchmark file after collection and retained the machine-readable results. Each VM remained online with only its root volume.
This engineering validation does not define a storage service-level objective. The sample does not represent every workload, concurrency level, queue depth, filesystem, cluster load, or failure condition. We did not test failover, host recovery, migration, backup, or restore behavior. Test your workload and recovery procedure before selecting a storage tier.
Why the performance and cost models differ
A local volume reaches a disk installed in its compute host. The I/O path avoids storage-network transport, remote storage processing, and replica acknowledgements.
Shared replicated storage performs more work for every customer write. ZCP stores three copies of each block across separate storage hosts. It also consumes storage-network bandwidth, CPU, memory, and operational capacity. These costs support a different availability model.
Consider a fully written 100 GB volume under the current rates:
| Storage model | Customer price | Approximate data footprint for 100 GB written |
|---|---|---|
| Local SATA SSD | CA$7/month | About 100 GB, before metadata and operating headroom |
| Local NVMe | CA$10/month | About 100 GB, before metadata and operating headroom |
| Shared replicated NVMe | CA$14/month | About 300 GB at three replicas, before metadata and operating headroom |
Local storage has a lower price per customer GB. The price difference reflects its host-level failure boundary.
Current root-storage pricing
The current rates are in Canadian dollars. The plans are not yet listed in the customer portal, so contact ZSoftly for provisioning:
| Tier | Root-storage model | Current rate |
|---|---|---|
b2.l1 | Host-local NVMe | CA$0.10/GB/month |
b2.l2 | Host-local SATA SSD | CA$0.07/GB/month |
b2.g1 | Shared replicated NVMe | CA$0.14/GB/month |
b2.g2 | Shared replicated SSD | CA$0.09/GB/month |
The local root tiers offer fixed 40, 60, 80, 120, 160, 200, 320, and 400 GB sizes, plus a custom size.
Optional backup is priced separately from local storage at CA$0.05/GB/month. Backup recovery depends on the configured schedule, retention, and restore process. Backup does not provide immediate failover or live migration.
The local plans are available in YUL-1. Capacity controls, customer risk acknowledgement, and recovery workflows still apply. Review the current pricing page or contact ZSoftly before placing an order.
What customers give up with local storage
Local performance comes with a clear failure boundary:
- The volume stays attached to one compute host.
- Normal cross-host live migration is unavailable.
- Storage-level replication is absent.
- Host maintenance creates workload downtime.
- A disk or host failure creates an outage and carries data-loss risk.
- Recovery after host or disk loss requires an application replica, an off-host backup, or another customer-owned copy.
Shared replicated storage places the volume outside one compute host. It supports host maintenance, workload recovery, and migration patterns unavailable to local volumes.
Where local root storage fits
Local storage suits workloads with an application-level recovery design:
- Database replicas where another node holds a current copy.
- Search indexes rebuilt from an authoritative source.
- Build runners and continuous integration workspaces.
- Caches, scratch volumes, and temporary processing data.
- Analytics jobs with source data stored elsewhere.
- High-I/O services with tested backup and restore procedures.
This benchmark supports local-versus-shared comparisons within each CPU family. It does not support a controlled NVMe-versus-SATA ranking. Select a local tier when its matched-pair result and host-level failure boundary fit the workload. Select shared replicated storage when the workload depends on shared storage and platform-level host recovery.
A root-storage choice, not a universal winner
Local NVMe and local SATA SSD led their matched distributed controls in random I/O, write throughput, and write latency. Shared replicated storage led both local tiers in 1 MiB sequential reads.
The result is a workload decision. Local storage favors latency-sensitive random I/O and write-heavy applications with their own recovery design. Shared replicated storage favors workloads that depend on platform-managed replication, host recovery, and migration.
Choose local storage when the application already provides replication or rebuilds. Choose shared replicated storage when the workload needs shared, replicated storage across hosts.
For teams evaluating a high-I/O workload in Montreal, contact ZSoftly with the root size, recovery objective, and expected I/O pattern. We will define a measured validation before launch.